How to start establishing visibility in a portfolio
There are several reasons why to use a portfolio management approach in a multi project / multi program setting. Stating the obvious, visibility is one of the key benefits. Leaving the subject of creating a portfolio aside, starting to establish visibility of the very same has its challenges and deserves a closer look.

Principal Portfolio Manager
There are several reasons why to use a portfolio management approach in a multi project / multi program setting. Stating the obvious, visibility is one of the key benefits. Leaving the subject of creating a portfolio aside, starting to establish visibility of the very same has its challenges and deserves a closer look.
For this purpose, data visualization describes the overarching activity utilizing figures and fragments of potential information, turning them into information for stakeholders by putting them into a visual context in space and time.
First things first. There is no silver bullet and no one size fits all solutions existing. In the same way portfolios need to be established fit for purpose it also applies to the subject of creating visibility. It is less about the variety and amount of data available. Data can be considered as raw material for information. Without classification and filtering into valuable content it is just noise. So, it is rather about how to turn these data into valuable information for our purposes. Out of simplification, I will refer to both as information.
What is the purpose?
The purpose of visualizing information is highly dependent on the evolving needs of stakeholders. Bearing in mind, a visualized portfolio is not just addressing one stakeholder(group) only. Stakeholders can be business leaders, leads of organizational units or team leads. As a consequence of their level and area of responsibilities, their interests and focus areas differ from each other.
One observation has re-occurred. Once a type of visibility has been established, stakeholders understand what visualized data (and subsequently information) can be utilized for. Furthermore, based on what is visible, they express desires what else they would like to have visualized. It is important to understand, visualization of a portfolio is a journey and subject to frequent changes and amendments.
Where to start?
A good starting point is to check what information is already available. Information flows such as established lines of communication (i.e. reportings, updates and events) and information reservoirs (shared drives, data sheets and KPI's on local level) provide usually a plethora of information to be utilized and visualized - and are subsequently a good point to start with.
How to start?
Based on the organizational unit, there are different lines of communications in place. This will determine for the start, whether to use a push principle (somebody actively provides information, regardless of specific demands) or a pull principle (tailored information on request). An important factor is the cadence, as this will define the information age. Therefore, it needs to be understood what the (initial) purpose of the visualization is. In conjunction with that, it can be necessary to define the level of required granularity first, before identifying sources.
Has this been clarified, it is helpful to use a format where all information flow together. Ideally, this is being automatized to ensure that the data is consistent and up to date in reflection of the cadence of sources.
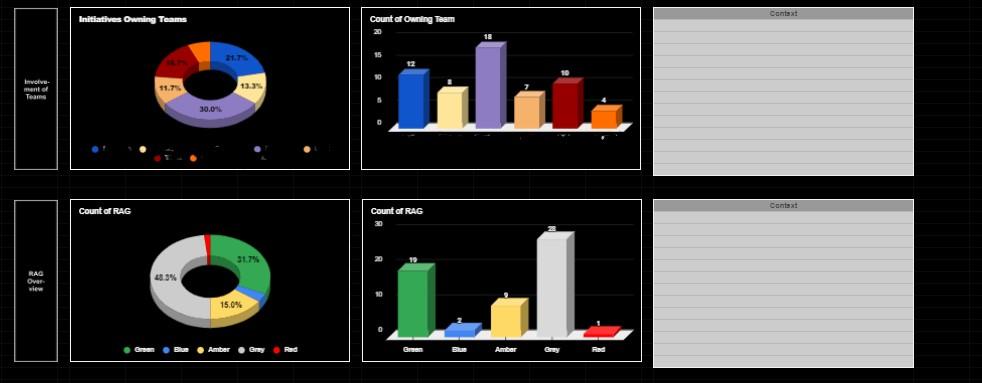
Dashboards are the common way to visualize data (and information). They comprise usually from graphs and diagrams and express information in a very technical way. Another form of visualization is storytelling by data. Here information is provided in a multilayered way by addressing a subject with visual connotation such as pictures, comics and simplified texts, while adding figures and information of interest into the overlay. In between there are countless hybrid forms existing.
What to be aware of when starting to establish portfolio visibility:
Inertia and entropy: Like anything else, a visualization is subject to inertia and entropy. Constant maintenance and scrutinization is therefore required.
Data is neutral: Data has no value. Only in the way a narrative is being constructed, data (and information) will be valued.
Resistance: The utilization of existing data streams and flows is important. The maintenance costs (time etc) of keeping data flows alive by quantity and quality need to be considered. Otherwise, it will be hard to establish a continuity.
Do not wake the dog! Establishing visualization for the sake of it won't work. Better less but durable than more but short lived like a mayfly.